
Scientists talk science for most of their day. Their audience is mainly their peers, and research students. With growing encouragement, a lot of scientists are making an effort to communicate to public. Different modalities are exploited to this effect, from writing in popular magazines and blogs to public speaking. Apart from talking to general audiences, scientists often give talks about their world in high schools and colleges with the purpose of getting students interested in science as a career choice. These engagements have forced scientists to write and speak in a jargon-free and lucid manner.
Scientists involved in science communication and science outreach have developed methods and strategies to speak and write about their work in a comprehensive to their audience. Visuals are not aesthetic tools for attention grabbing, but are useful tools in science storytelling. Biased by nature of my work, I make a special case for the large domain of cell and molecular biology.
Cellular scale is beyond the perceptive scale of human visual system. That makes it harder for an untrained audience to imagine the dynamic processes that are happening inside cells. They depend on our words and visual clues to form microscopic universes in their imagination, wherein the processes we describe seem plausible.
What kind of visuals are used in these cases? Beautiful microscopic images accompany articles and are pasted on first slides. They are perfect for grabbing eye balls and creating interest. Very often, (may not be true for all) scientists recycle their presentations meant for scientific peers for public and younger students as well. The schematics used there range from symbolic shapes, 2-D schematics, cartoons and realistic graphics. Most used among them are symbolic shapes or 2-D schematics developed on abstract shapes of circles, and rectangles in different colors represent different biomolecules. This method of 2-D schematics, often abused, was developed with careful thought and deliberation 30 years ago. This uniform code of schematic representation was developed by Keith Roberts, the chief illustrator of the iconic text “Molecular Biology of the Cell”. For the development of this teaching tool, the team of authors decided to keep a uniform code of representation, such that same representations of molecules could feature in different subjects. These were simplistic drawings based on hand drawing that were later adapted for printing by primitive digital methods. Despite the limitations of digital methods and printing techniques, this style of schematics was helpful and continues to be so. There was an attempt to portray form, scale and interaction surfaces.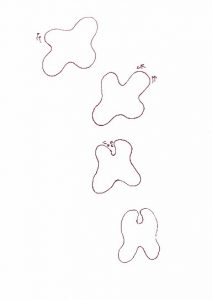
A hypothetical protein changing conformation, based on Keith Robert’s style. Notice the shift in forms and use of strokes outside the protein to indicate motion.
As the information on structural and function has become increasingly available, there are possibilities for incorporating more accurate details within illustrations. With the development of visualization tools, there is possibility for more realistic representations. Some of these tools, for both 2-D and 3-D representations incorporate structure-based information from cryo-EM and crystallography to concepts like molecular crowding and thermal motion (Goodsell et al., 2018). However, scientists continue to adopt insufficient methods. The figures are simplified derivatives of 2-D schematics developed by Keith Roberts and others. Apart from relationship to each other, these schematics often provide no information about the process.
In such a case, the imagination of the audience falls short. Scientists assume, and the audience is compelled to imagine the cell and molecules with insufficient clues. Imagine this story about RNA polymerase transcribing this piece of coding DNA. Which one is relevant to the audience?
In various schematics on DNA transcription on left hand side an increasing level of information conveyed.
Schematic 1 shows a physical interaction between RNA polymerase and DNA.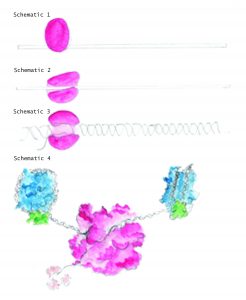
Schematic 2 hints at the groove of RNA polymerase that interacts with the DNA.
Schematic 3 depicts double helical DNA, transcription bubble formation, RNA polymer synthesis, and form of RNA polymerase.
Schematic 4 depict the RNA polymerase interaction with DNA in context of chromatin/histone octamers. It also hints transcription bubble, overall form of the proteins, RNA-binding proteins, bend in DNA during the process.
In public science talks delivered by PhD students and postdoctoral fellows under the ScienceHigh platform to an audience of mostly non-scientists, several have been based on cell and molecular biology. As a coordinator, my qualitative observation has been that people who use poorly developed 2-D schematics are poorly understood by the audience. This has also been asserted by other science communicators and educators as well.
Even while talking to young students, use of these circles and rectangles, limit the questions they can ask. That rectangle bar representing a piece of DNA, it tells you that it is a linear sequence and that is a physical entity. The relationship with sizes are not respected. With the information about width of DNA, length of DNA, length of minimal promoter and dimensions of RNA polymerase, it is plausible to draw a schematic that respects these scales and orientation of other molecules in the complex. It is similarly possible to show the double helical molecule, the context of being wrapped and unwrapped from around histones, the buildup of physical strain. Without these clues, the students might find it harder to imagine how transcription process is energy consuming and can cause DNA damage. One could also imagine a situation where someone who recognizes and remembers DNA as a double helical structure is confused. Such schematics limit the information that is understood, retained, and the questions that are asked based on it. Lack of comprehension can deter interest in sciences.
As someone who is working on visual mode of science communication, I believe that scientists need to carefully think what they want to convey and ask will their audience understand this. Apart from language, the practice of representations and schematics also need attention. It is perhaps not possible to incorporate each aspect of cell or molecule in our schematics, but these have to developed with much deliberation and contemplation.
With the growing interest in science communication among scientists, a parallel interest in visualizing science for the purpose of science communication and education is required. Scientists should work with artists and illustrators and animators. Scientists seek help from them often only to make neater schematics for reviews etc. Instead, they should engage in dialogue with mutual respect, where both parties appreciate each other’s talent and skill and work together to build representations of the processes that is comprehensive and legible to larger audience across specializations. Having been part of such processes, I can assure that scientists would realize that making such collaborations allow not only for greater comprehension of the subject for them and their team itself, it also raises several questions that they never thought of. Working with artists, and the question the latter ask would push the boundaries of current science by forcing them to think beyond their niche.
With much to be gained, the scientific community should try to spend thought, time and resources in developing right images for the intended audience.
Further reading:
Goodsell, D.S., Franzen, M.A., and Herman, T. (2018). From atoms to molecules: Using mesoscale landscapes to construct visual narratives. J. Mol. Biol.
About author:
Ipsa Jain is artist in residence at Cytoskeleton lab, InStem (www.cytoskeleton-lab.org ). Find out more about ScienceHigh at www.facebook.com/csgsciencehigh. You can see some of her science inspired artwork at www.ipsawonders.com . She will be happy to hear from you at ipsajain.31@gmail.com. The ideas discussed here have their origin in discussions with fellow science visualizers from across the world.